An Air Quality Study in 5 Care Homes in the UK
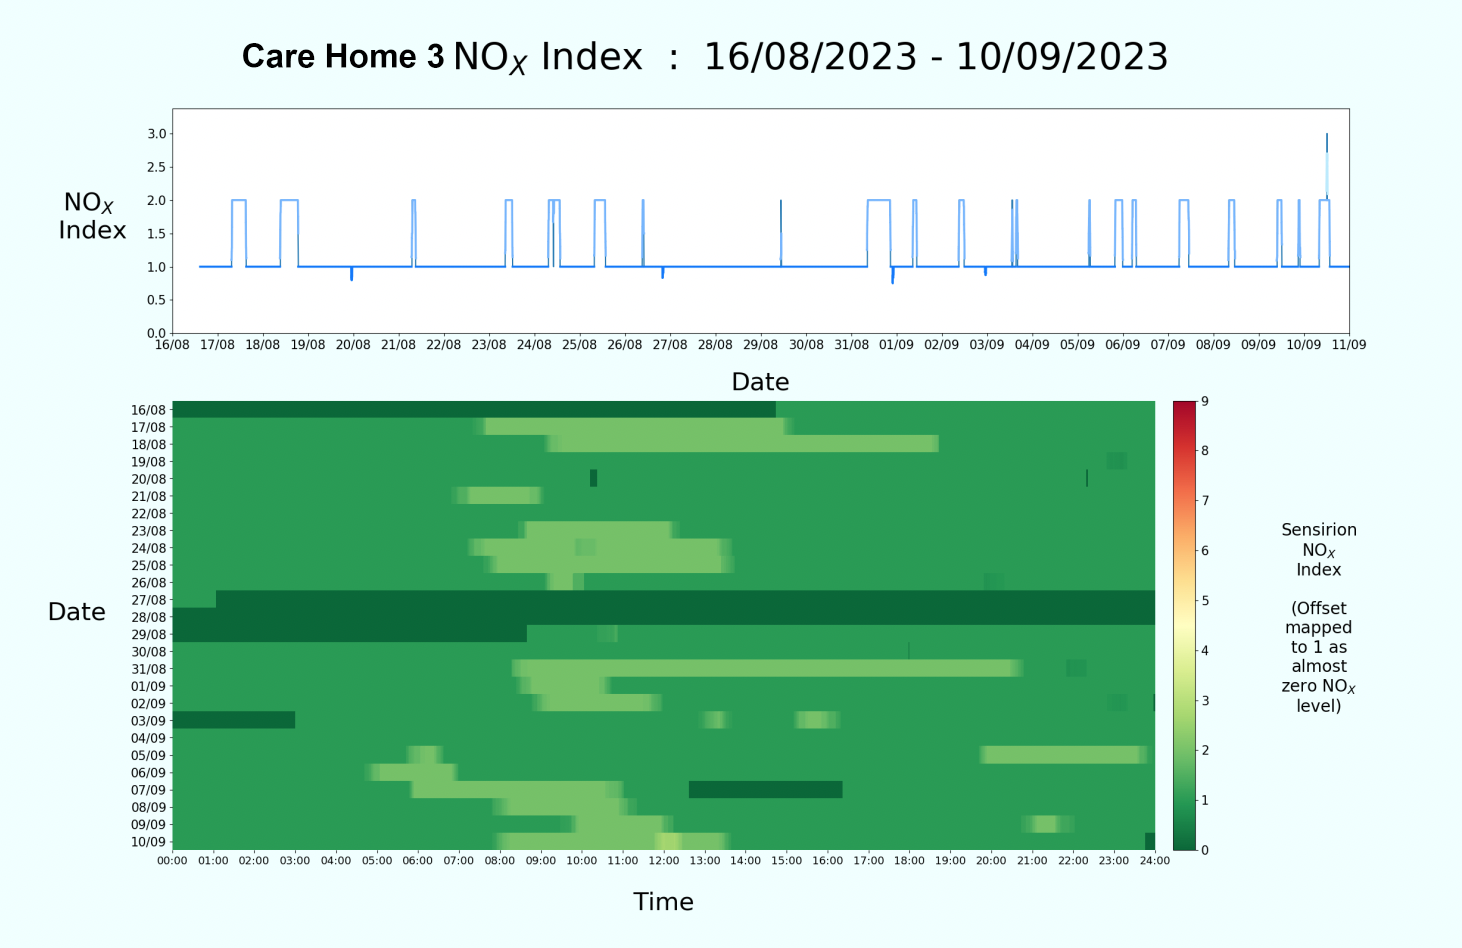
NOx: Across all care homes over the period NOx levels remained broadly consistent. The most significant amount of NOx activity occurred for ‘Care Home 1’ between around the 6th and the 9th, and ‘Care Home 2’ between around the 3rd and the 8th. The latter end of this period for ‘Care Home 2’ also saw some of the highest NOx indexes of the period.
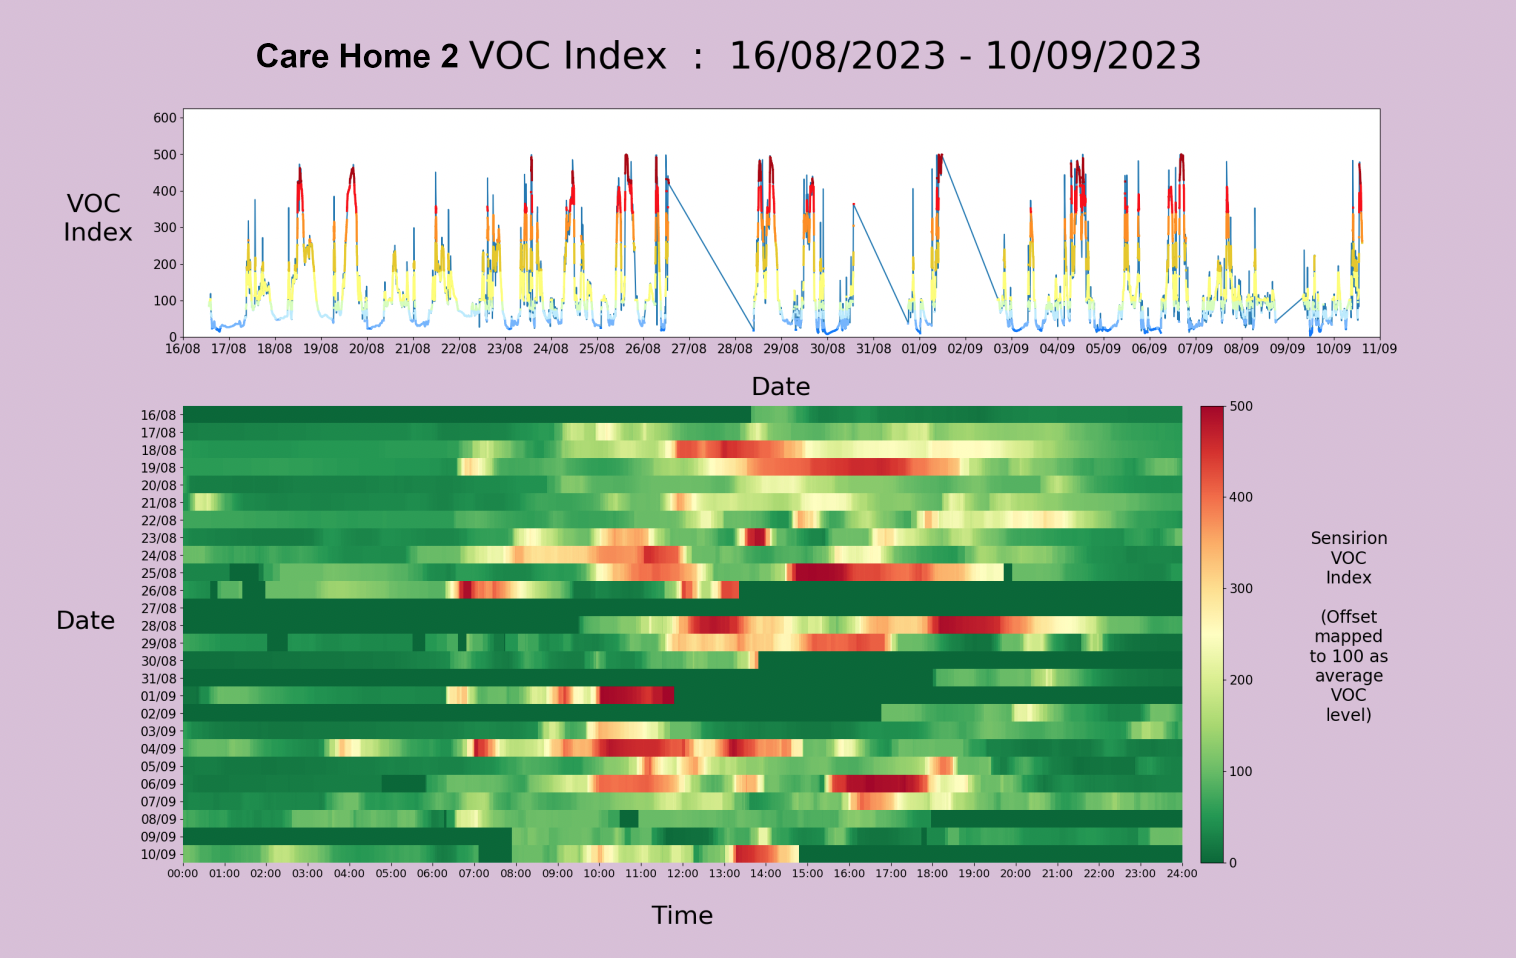
VOC: Across all detectors, there was a slight tendency for the VOC activity to be marginally higher over the second half of the period compared to the first. The periods with the most VOC activity for each unit then were as follows: ‘Care Home 5’ – on the 25th and between around the 3rd and the 6th; ‘Care Home 3’ – between around the 1st and the 6th, as well as the 10th; ‘Care Home 2’ – the 28th, the 4th and the 6th; ‘Care Home 1’ – the 31st and the 3rd; and ‘Care Home 4’ – the 3rd.
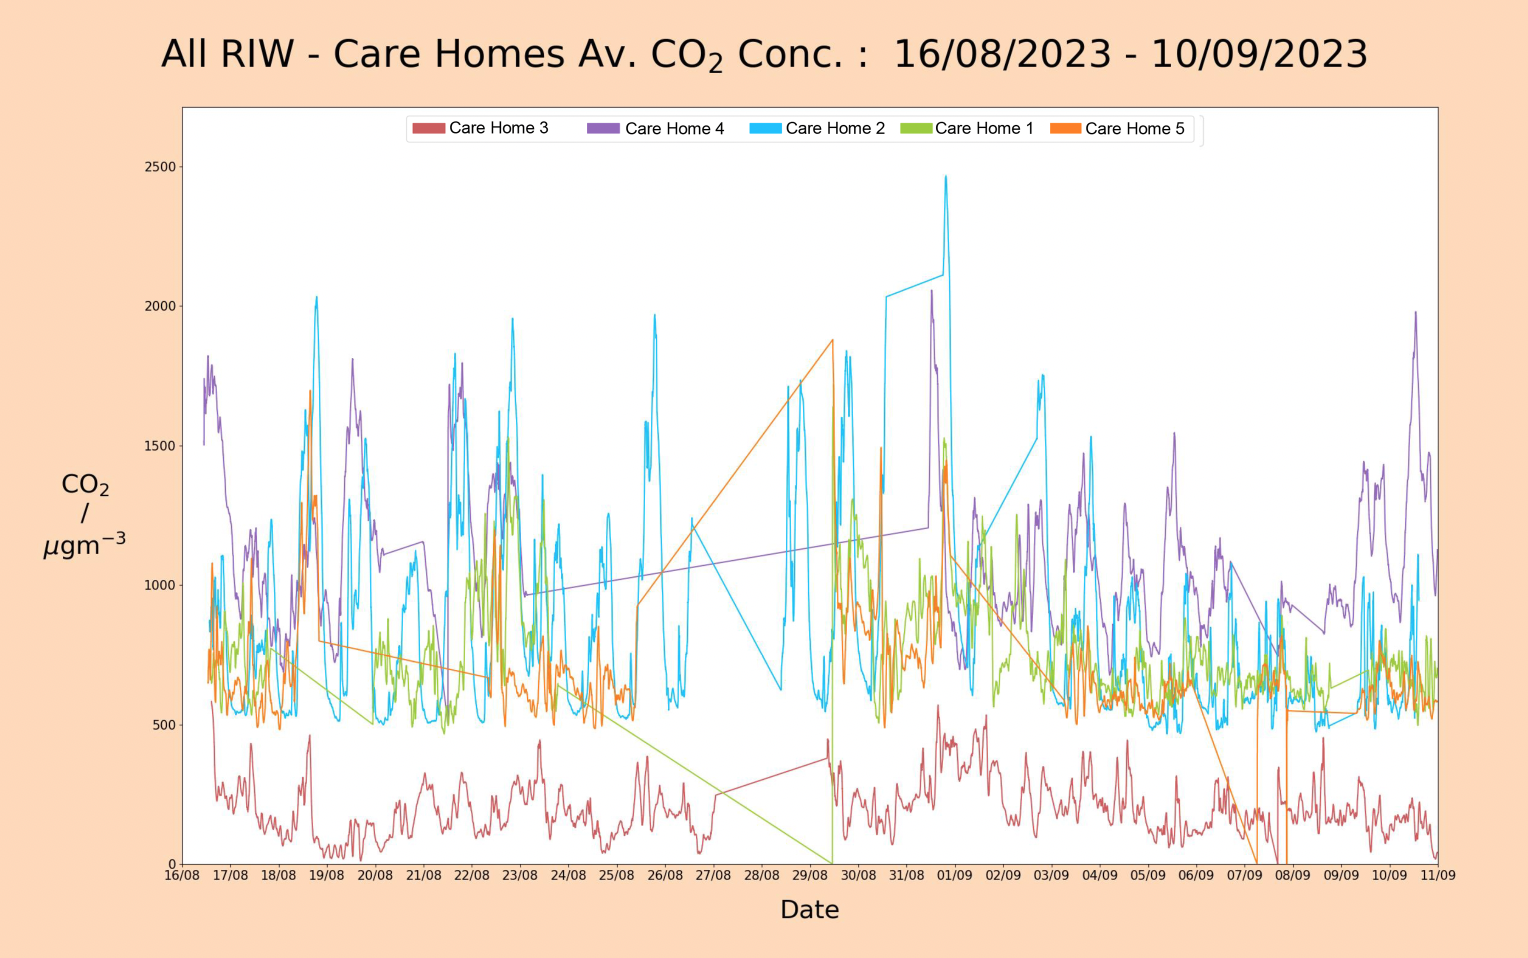
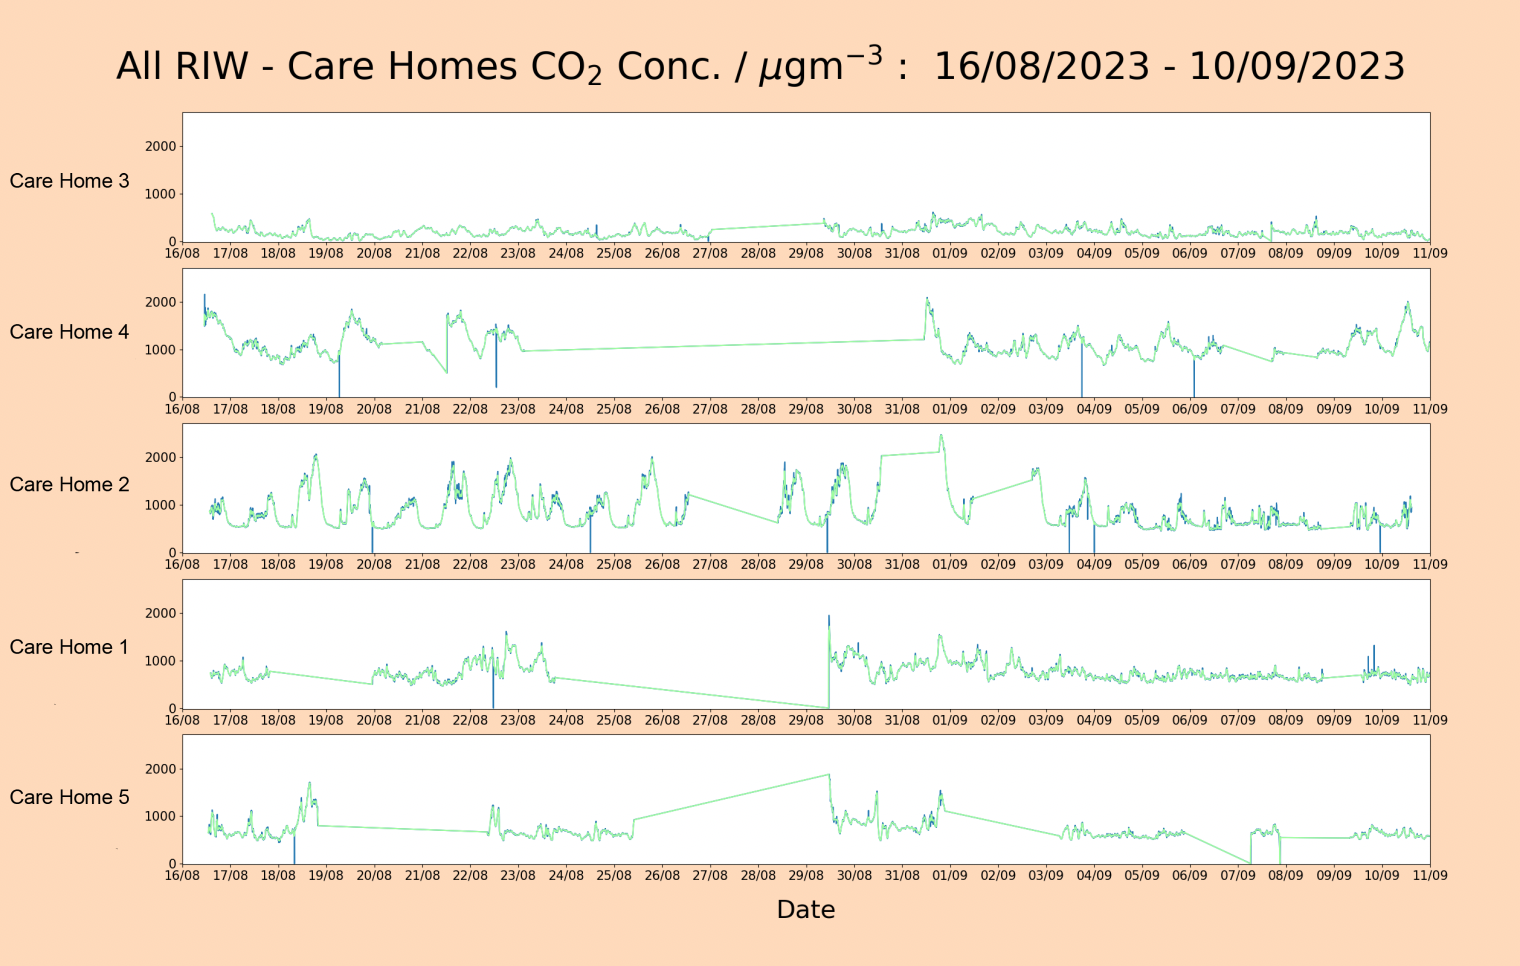
CO2: The most prominent feature in CO2 concentrations across the network was that general CO2 level for ‘Care Home 5’ was consistently lower than that recorded in the other care homes over the whole period. Besides this, ‘Care Home 3’ saw peaks on the 16th, the 19th, the 21st, the 31st and the 10th. ‘Care Home 2’ also saw peaks on the 18th, the 21st, 22nd, the 25th, the 28th, the 29th and the 3rd. However, ‘Care Home 1’ only saw marginally elevated periods between around the 22nd and the 24th, and from the 29th to around the 2nd. Lastly, ‘Care Home 4’ saw a peaks on the 18th, the 29th and late on the 31st.
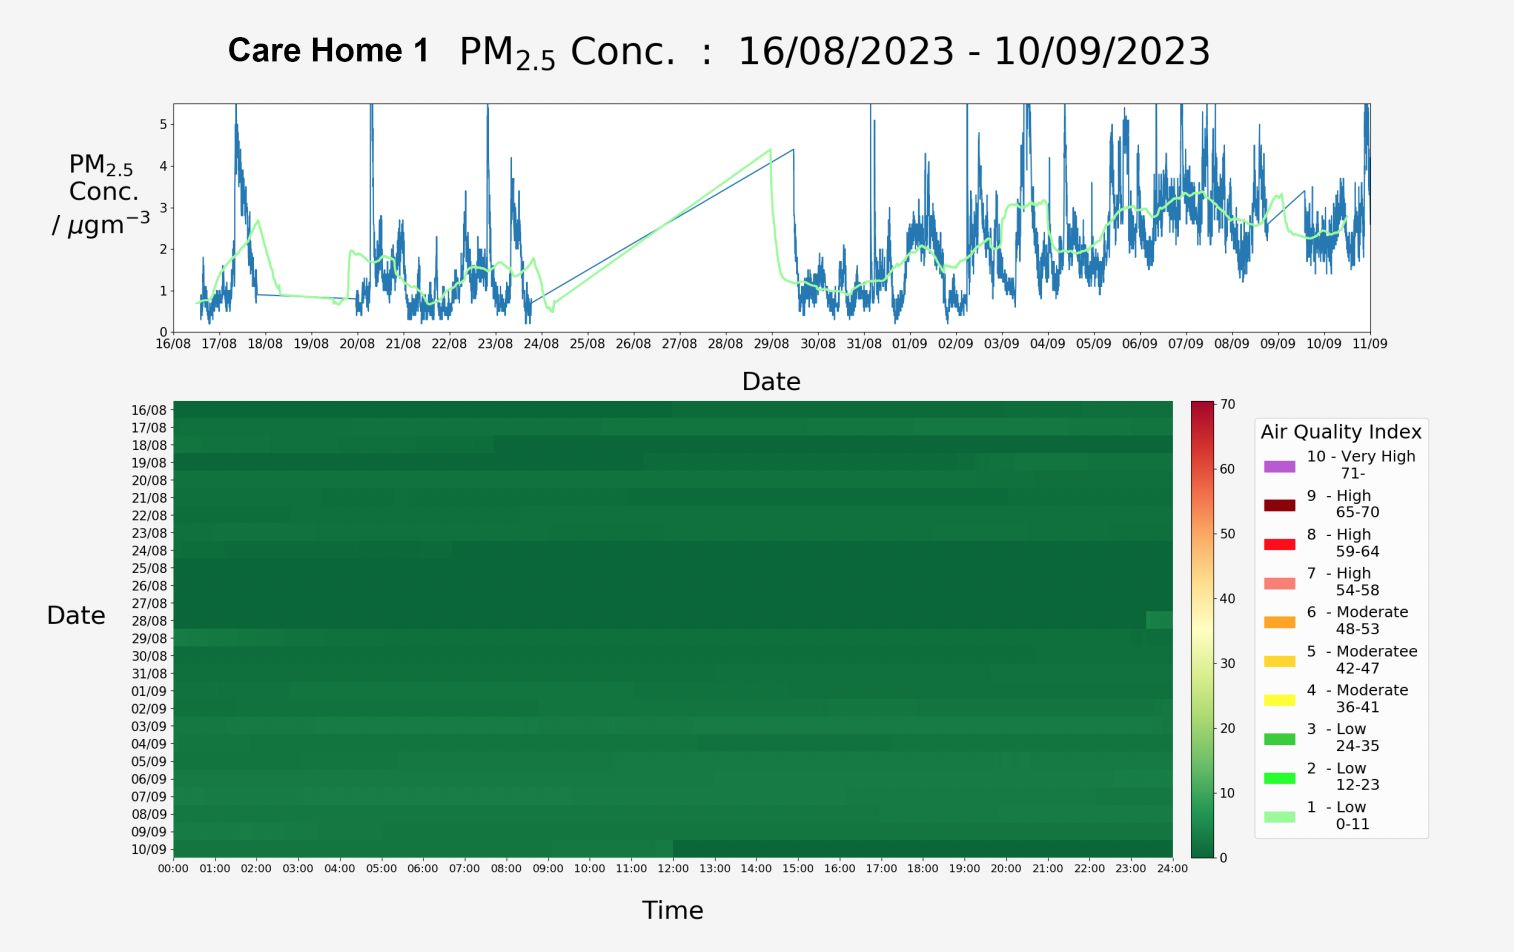
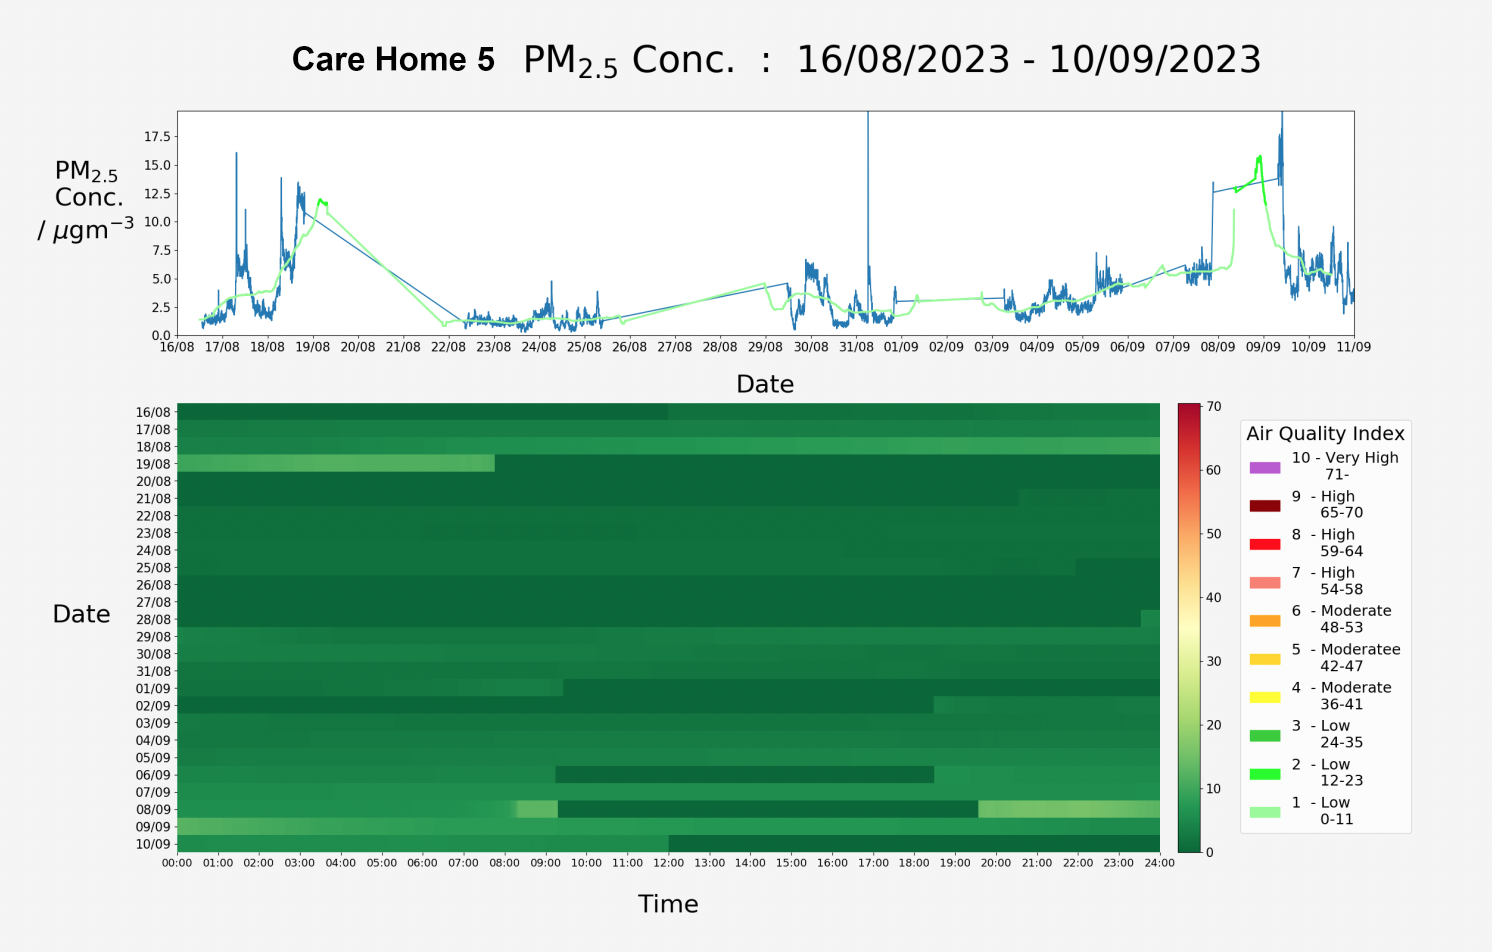
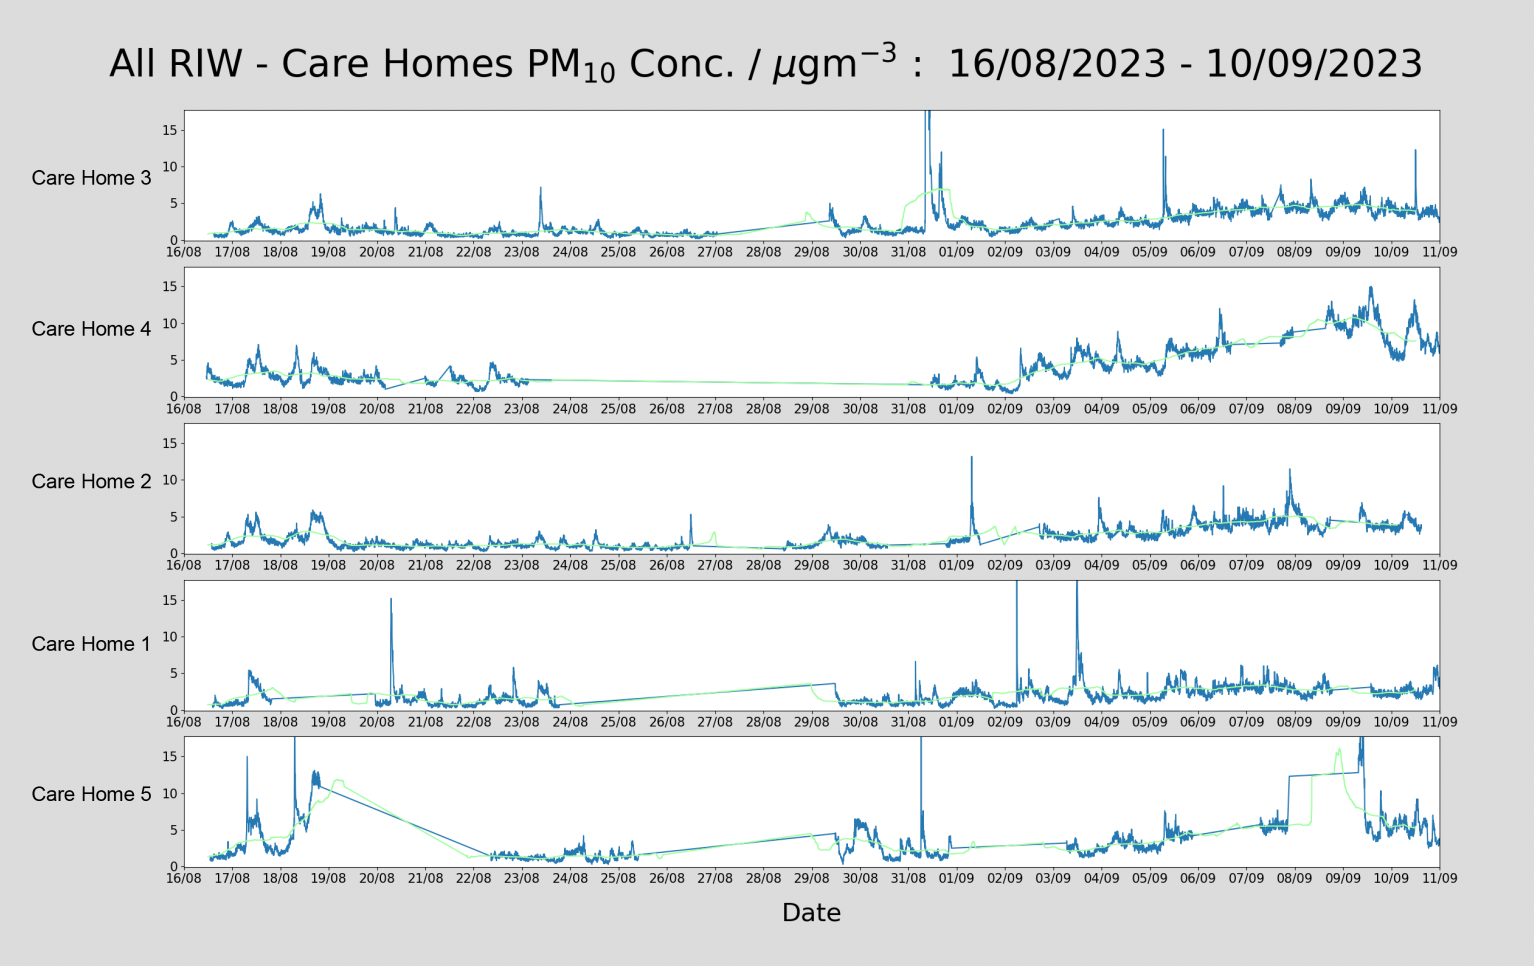
PM2.5: Very prominent spikes in PM levels were seen on the 31st for ‘Care Home 5’, on the 20th and the 3rd for ‘Care Home 1’, and on the 17th and the 31st for ‘Care Home 4’. Besides this, there was also a general tendency for the general PM level to increase from around the 1st until the end of the period. This feature was present for the majority of detectors, to varying degrees, but was by far the most prominent for ‘Care Home 3’.
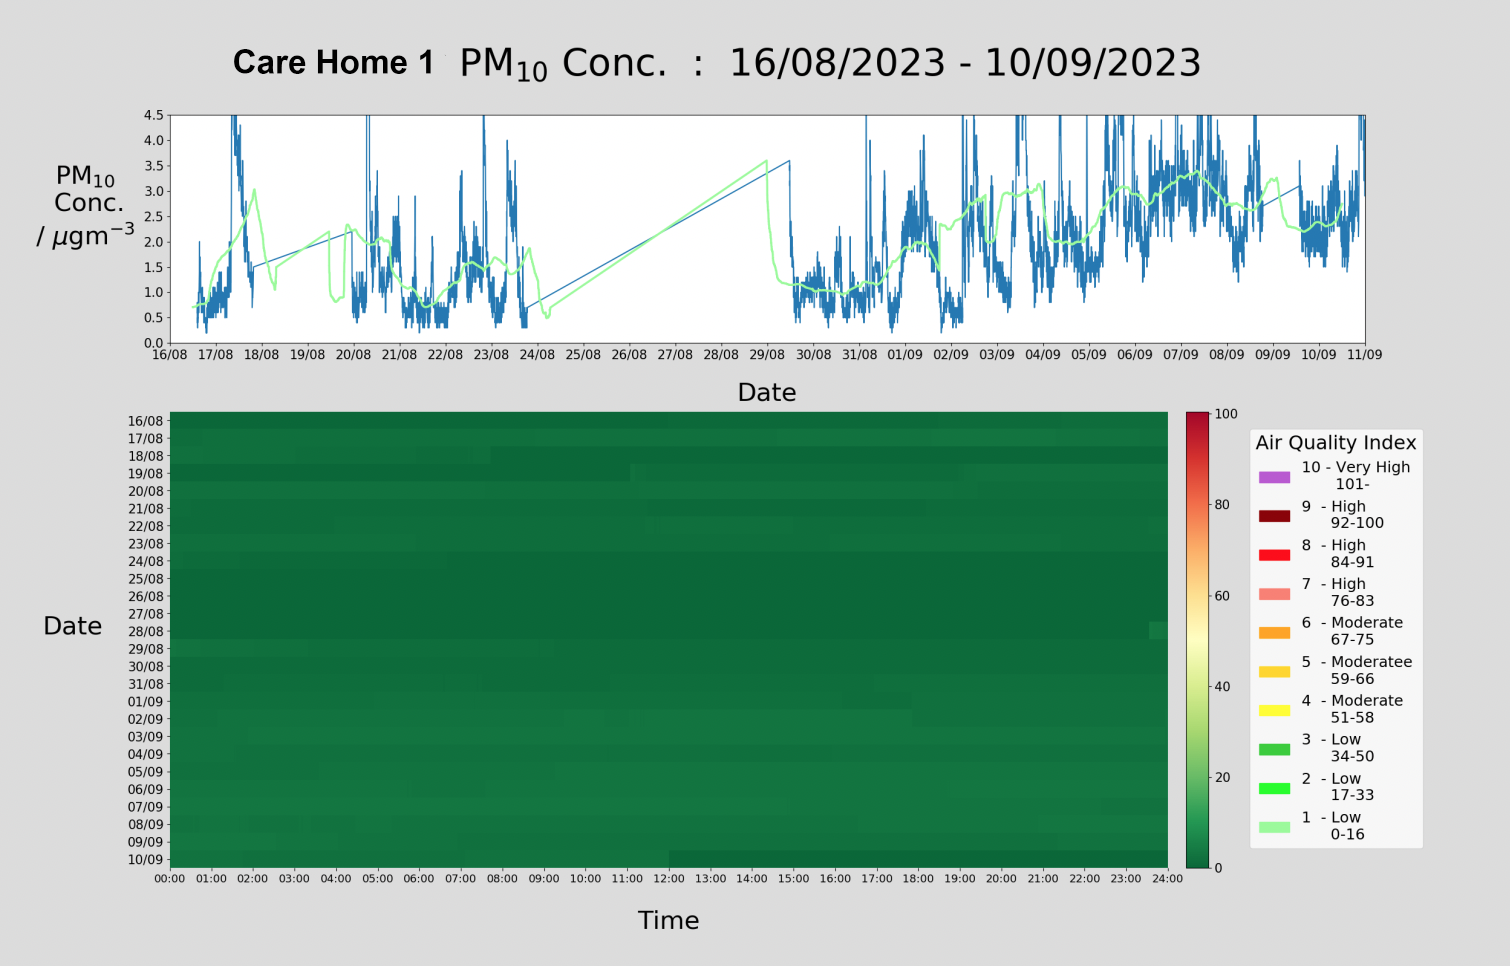
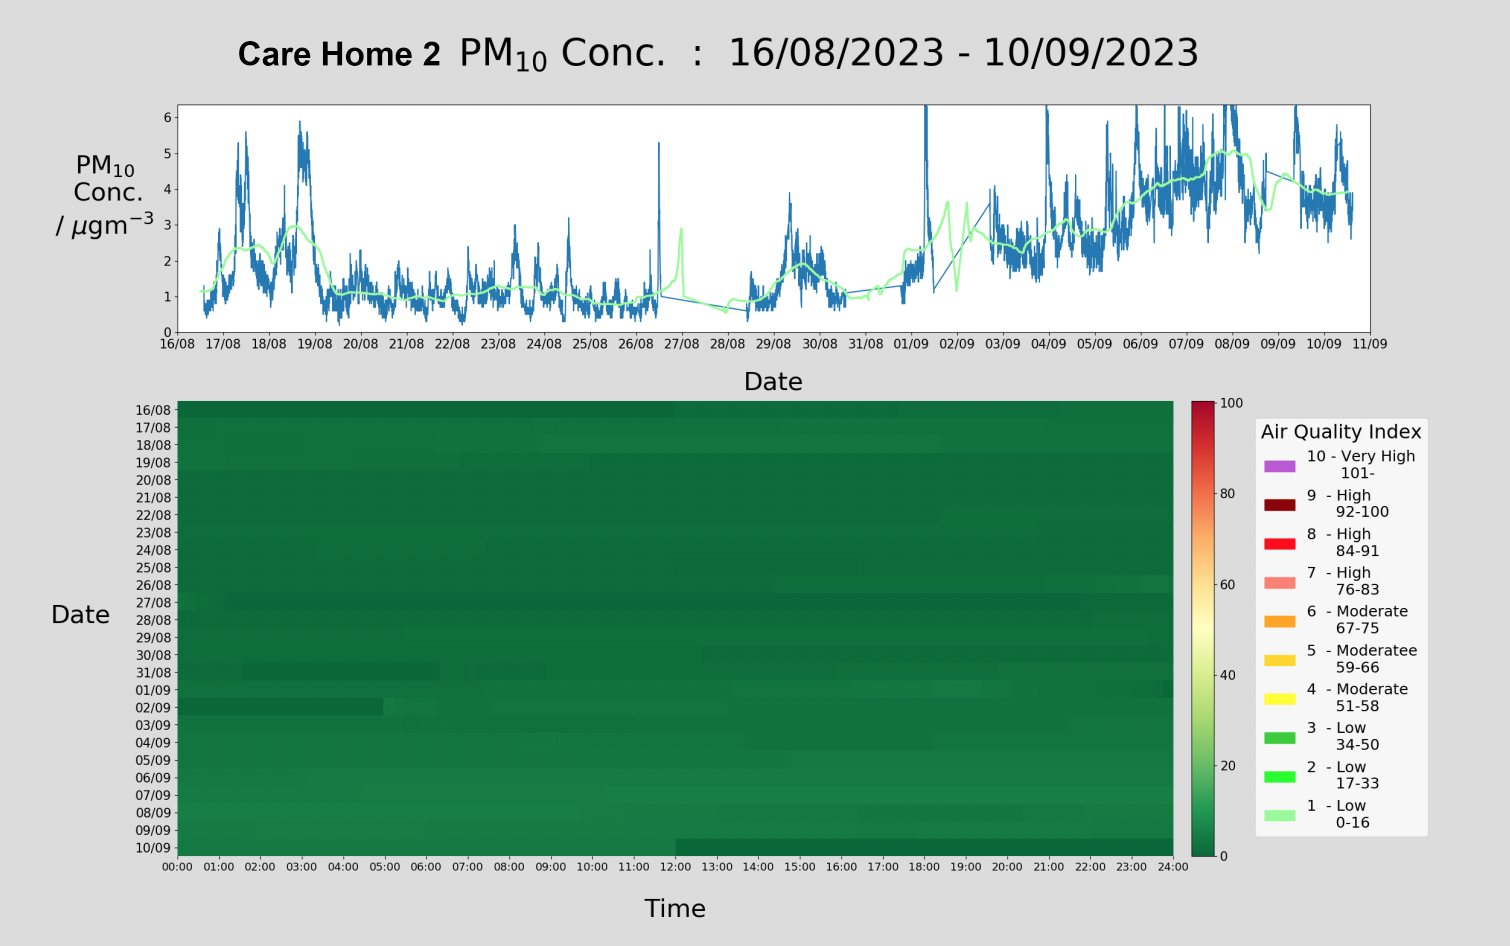
PM10: In addition to the trends described for PM2.5, ‘Care Home 5’ also saw a PM10 spike on the 5th, and ‘Care Home 2’ saw one on the 1st.
Nox; tobacco smoke and gas-, wood-, oil-, kerosene- and coal-burning appliances such as stoves, ovens, space and water heaters and fireplaces, particularly unflued or poorly maintained appliances.
VOCs are emitted by a wide array of products including paints and lacquers, paint strippers, cleaning supplies, pesticides, building materials and furnishings, office equipment such as copiers and printers, correction fluids and carbonless copy paper, graphics and craft materials including glues and adhesives, permanent markers, and photographic solutions, varnishes, and wax all contain organic solvents, as do many cleaning, disinfecting, cosmetic, degreasing, and hobby products. Fuels are made up of organic chemicals.
CO2Indoors is mainly produced through the respiration (breathing) of occupants but can also come from:cigarette smoking. unvented or poorly vented fuel-burning appliances
PM2.5 & 10 Indoor activities generate particles, such as vacuuming and dusting, as well, includingsmoking tobacco, cooking and burning wood, candles or incense. Particles also can form indoors from complex reactions of gaseous pollutants emitted from such sources as household cleaning products and air fresheners. Also components derived from biological sources, many of which are known allergens, such as pollens, mold spores, dust mites and cockroaches